7.2. KPIs Detailed View
Overview
Key Performance Indicators, or KPI, is an analysis module which helps the user to quickly visualize the detailed business related information for each main system entity - Endpoint, User, Project.
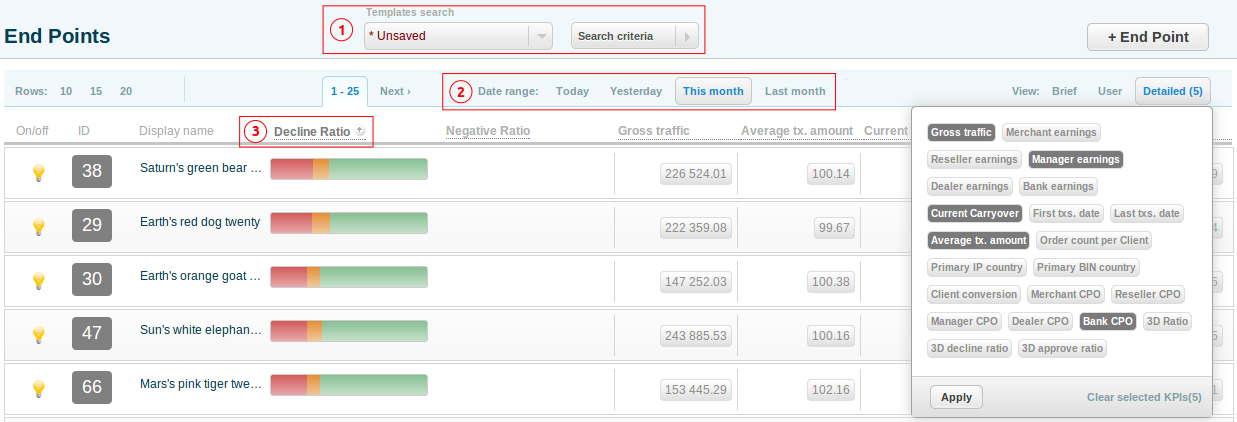
To view the details of the relevant element, open the respective element common screen and pick the KPIs in the dropdown Details menu. The order of KPI shown on the details view corresponds to the order in which KPIs are picked in the dropdown. The first chosen KPI is placed on the left, then goes the second etc. The user can pick up to 5 KPIs.
The search criteria (point 1 on the screenshot) only affect the list of elements shown and not the calculated value of the KPI.
The KPI value could be calculated within a time period (the control elements 2` on the picture above). The time period is ignored when the meaning of the KPI contradicts the selected date range or in case the KPI is beside the purpose.
Each KPI could be used for sorting to provide the most valuable data. The user can apply the sorting by clicking the name of KPI(the control element 3 on the picture above). Please keep in mind that if KPI is selected for sorting and then removed, the sorting will still be applied.
KPIs
Gross Traffic
Shows: The total sum of the approved transactions of the types: sale, capture, dispute, transfer approved.
Update frequency: virtually real-time (no more than 10 seconds delay).
Graph: the total sum per hour if selected date range is Today or Yesterday; the total sum per day if selected date range is This Month or previous Month.
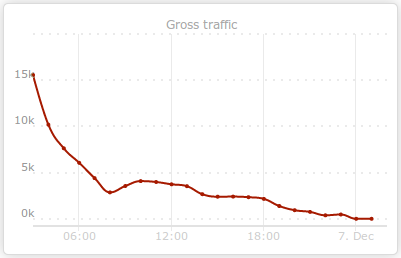
Gross traffic per hour for December 7th.
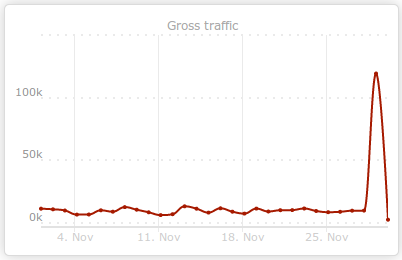
Gross traffic per day for November.
Earnings
Shows: earnings for the Reseller or Merchant without holds for any type of transaction in any status.
Update frequency: virtually real-time (no more than 10 seconds delay).
Graph: the earnings per hour if selected date range is Today or Yesterday; the earnings per day if selected date range is This Month or previous Month.
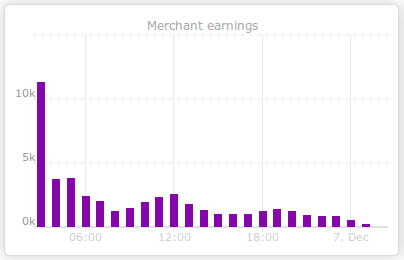
Merchant’s earnings per hour for December 7th.
Carryover
Shows: The value of the Carryover for the current date disregarding the selected date range. Each type of user can see respective value of the Carryover.
Update frequency: daily at 00:00.
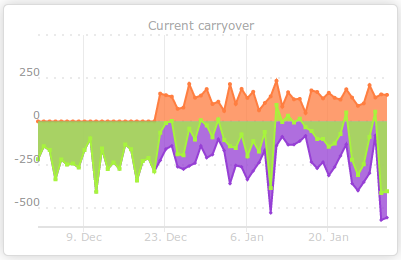
Graph: shows the carryover value staring from the selected date plus 2 months; it shows both total carryover due by the user (positive) and the carryover due to the user (negative). It also shows the carryover balance which is a sum of the two above values.
The Dates Of The First And Last Transactions
Shows: The date of the first and last processed transaction regardless of the date range chosen. It allows quickly finding inactive instances of the infologic model elements (Endpoints, Projects).
Update frequency: virtually real-time (no more than 10 seconds delay).
Graph: N/A
Average Transaction Amount
Shows: The average transaction amount: sale, capture, dispute, transfer in approved status. It allows to detect abnormalities when merchant changes the source of incoming payment traffic or the products sold.
Update frequency: virtually real-time (no more than 10 seconds delay).
Graph: Minimal, maximal and average transaction amount per hour if selected date range is Today or Yesterday; the Minimal, maximal and average transaction amount per day if selected date range is This Month or previous Month.
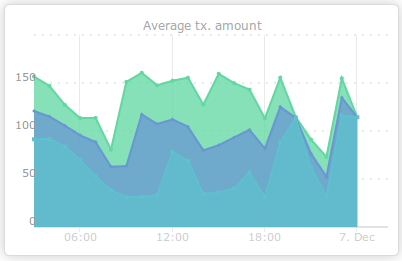
Minimal, maximal and average transaction amount per hour for December 7th.
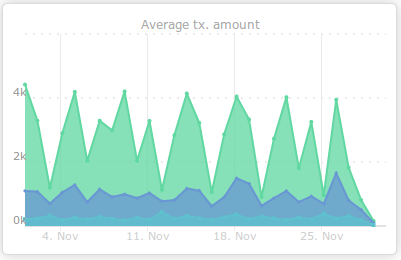
Minimal, maximal and average transaction amount per day for November.
Order Number Per Client Per Month
Shows: The average number of the transaction of any type and in any status for the month which falls into the selected date range. The KPI is only calculated for Endpoints and Projects. The definition of the customer is set up at the Project level, one card means one customer by default. The customer at the Endpoint differs from the customer at the Project to have an option to examine various sources of the payment traffic
Update frequency: virtually real-time (no more than 10 seconds delay).
Graph: the number of orders made by a customer per month ending by the chosen date and starting from the date of 12 months earlier.
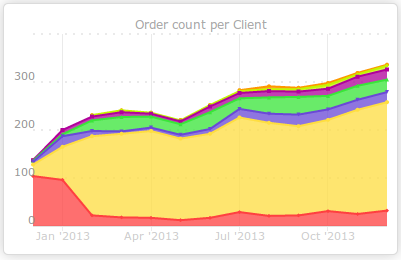
The number of orders made by a customer per month. Various numbers of orders are marked by different colors . The customers who made 5-6, 7-10 and more than 10 orders are united into one group.
The Returning Clients Conversion
Shows: The ratio of the repeated transactions made by a particular customer to the total number of transactions made by the customer for the month that fall into selected date range. The transaction is considered repeated for the chosen month if the customer has made a transaction at any time before. The KPI is only calculated for Endpoints and Projects. The definition of the customer is set up at the Project level, one card means one customer by default. The customer at the Endpoint differs from the customer at the Project to have an option to examine various sources of the payment traffic.
Update frequency: virtually real-time (no more than 10 seconds delay).
Graph: The ratio of the repeated transactions made by a particular customer to the total number of transactions made by the customer per month ending by the chosen date and starting from the date of 12 months earlier.
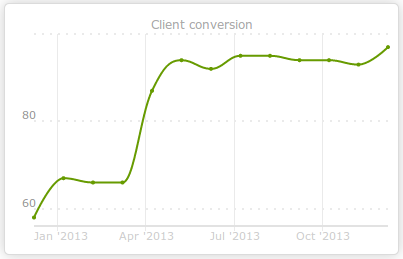
The ratio of the repeated transactions made by a particular customer to the total number of transactions made by the customer per month for the past year.
Transactions By Country By Client’s IP Address
Shows: The country is determined by the IP address of the customer. The transactions of any type in any status are taken into consideration. The parameter does not depend on the date range and is calculated for the lifetime.
Update frequency: daily at 00:45.
Graph: The number of transactions of any type in any status per country which is derived from the customer’s IP address for the given date range, refreshed every 10 seconds.
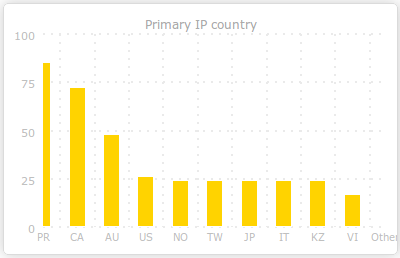
The number of transactions for top 10 countries which are derived from the customer’s IP address
Transactions By Country By BIN
Shows: The country is derived from the customer’s card BIN. The transactions of any type in any status are taken into consideration. The parameter does not depend on the date range and is calculated for the lifetime.
Update frequency: daily at 00:45.
Graph: The number of transactions of any type in any status per country which is derived from the customer’s card BIN for the given date range, refreshed every 10 seconds.
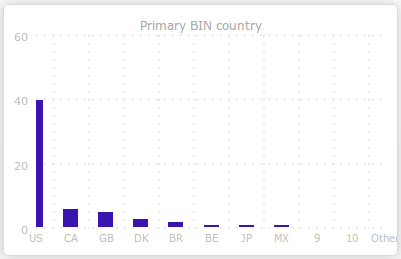
The number of transactions for top 10 countries which are derived from the customer’s card BIN.
Average Earnings Per Transaction
Shows: Average earnings per transaction for Reseller or Merchant without holds for any type of transaction in any status.
Update frequency: virtually real-time (no more than 10 seconds delay).
Graph: Average earnings per transaction per hour if selected date range is Today or Yesterday; the Average earnings per transaction per day if selected date range is This Month or Previous Month.
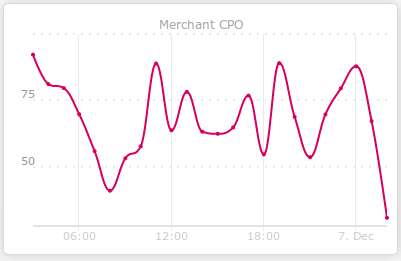
The Merchant’s average earnings per transaction per hour for December 7th.
3DS/non-3DS Ratio
Shows: The ratio of the number of 3DS/non-3DS sale, preauth, transfer transactions in approved, filtered and declined statuses to the total number of such transactions for the given date range.
Update frequency: virtually real-time (no more than 10 seconds delay).
Graph: The ratio of the number of 3DS/non-3DS sale, preauth, transfer transactions in approved, filtered and declined statuses to the total number of such transactions for the given date range per day starting from the month’s first date to the end date of the given date range.
Legend:
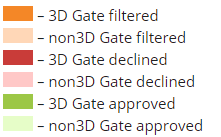
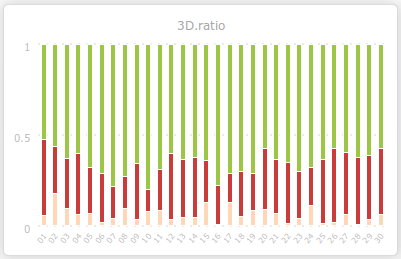
The ratio of the number of transactions in different statuses for 3DS Gate for November.
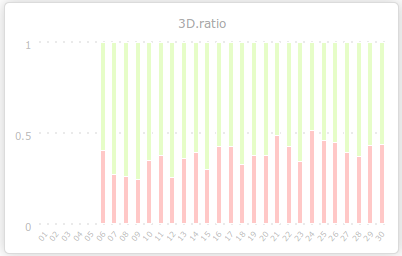
The ratio of the number of transactions in different statuses for non-3DS Gate for November.
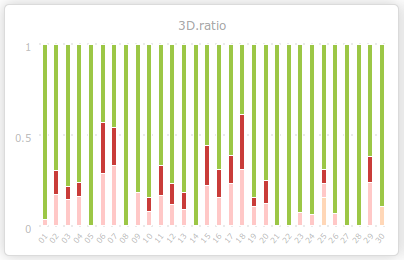
The ratio of the number of transactions in different statuses for November.
3DS/non-3DS Ratio For Declined Transactions
Shows: The ratio of the number of 3DS transactions in declined status processed with 3DS, for Enrolled cards which have MPI status Y or A to the total number of transactions of the types sale, preauth or transfer for the given period.
Update frequency: virtually real-time (no more than 10 seconds delay).
Graph: The ratio of the number of 3DS/non-3DS transactions in declined status per day for the given date range starting from the month’s first date to the end date of the given date range.
Legend:
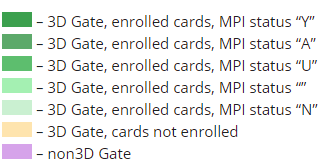
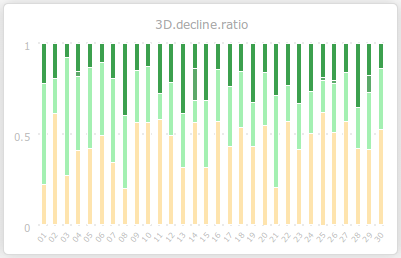
The ratio of the number of transactions in declined status with 3DS for November.
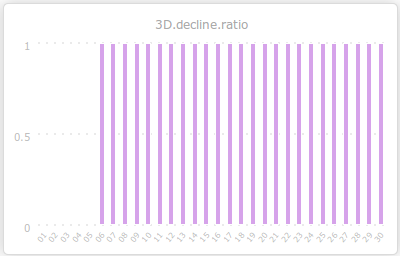
The ratio of the number of transactions in declined status with non-3DS for November.
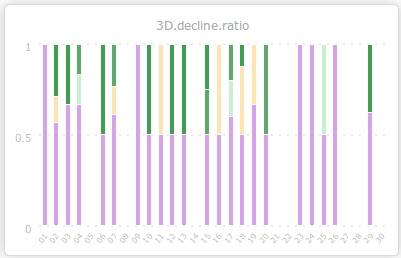
The ratio of the number of transactions in declined status for mixed traffic for November
3DS/non-3DS Ratio For Approved Transactions
Shows: The ratio of the number of 3DS transactions in approved status processed with 3DS, for Enrolled cards which have MPI status Y or A to the total number of transactions of the types sale, preauth or transfer for the given period.
Update frequency: virtually real-time (no more than 10 seconds delay).
Graph: The ratio of the number of 3DS/non-3DS transactions in approved status per day for the given date range starting from the month’s first date to the end date of the given date range.

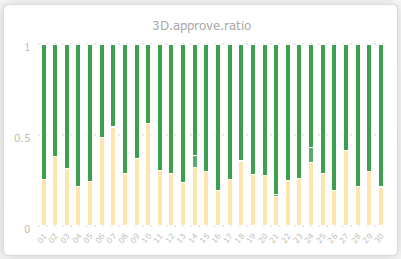
The ratio of the number of transactions in approved status with 3DS for November.
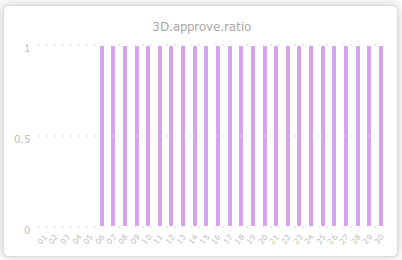
The ratio of the number of transactions in approved status with non-3DS for November.
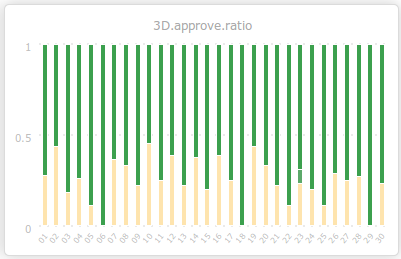
The ratio of the number of transactions in approved status for mixed traffic for November.
Warning
The MPI status and Enrollment status could be only determined if TopTechPay MPI plugin is being used or the Processor properly returns the data after 3DS verification.